C O D I N G P R O J E C T S
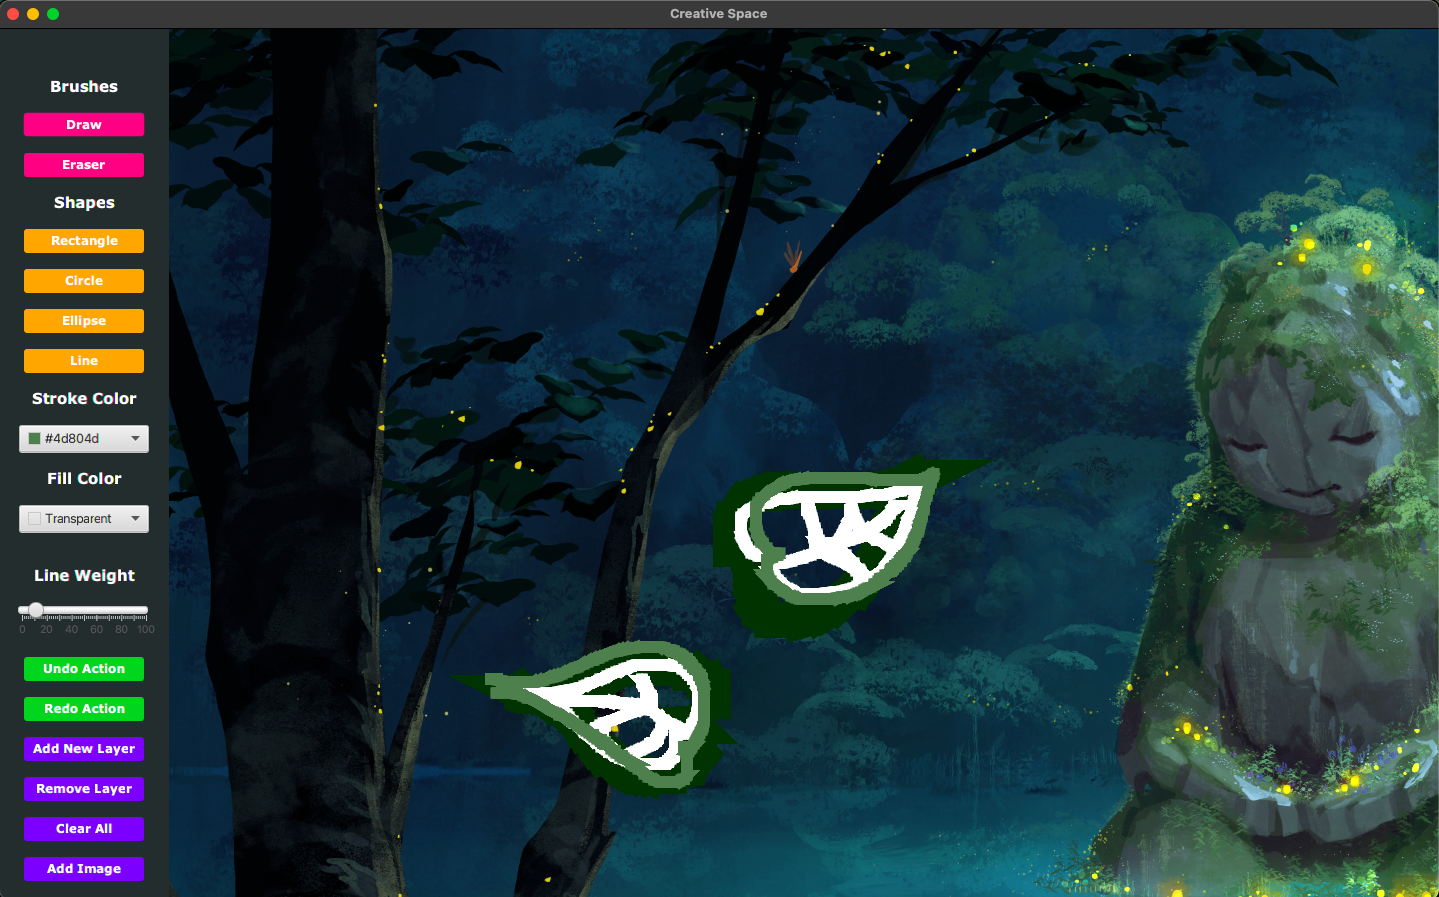
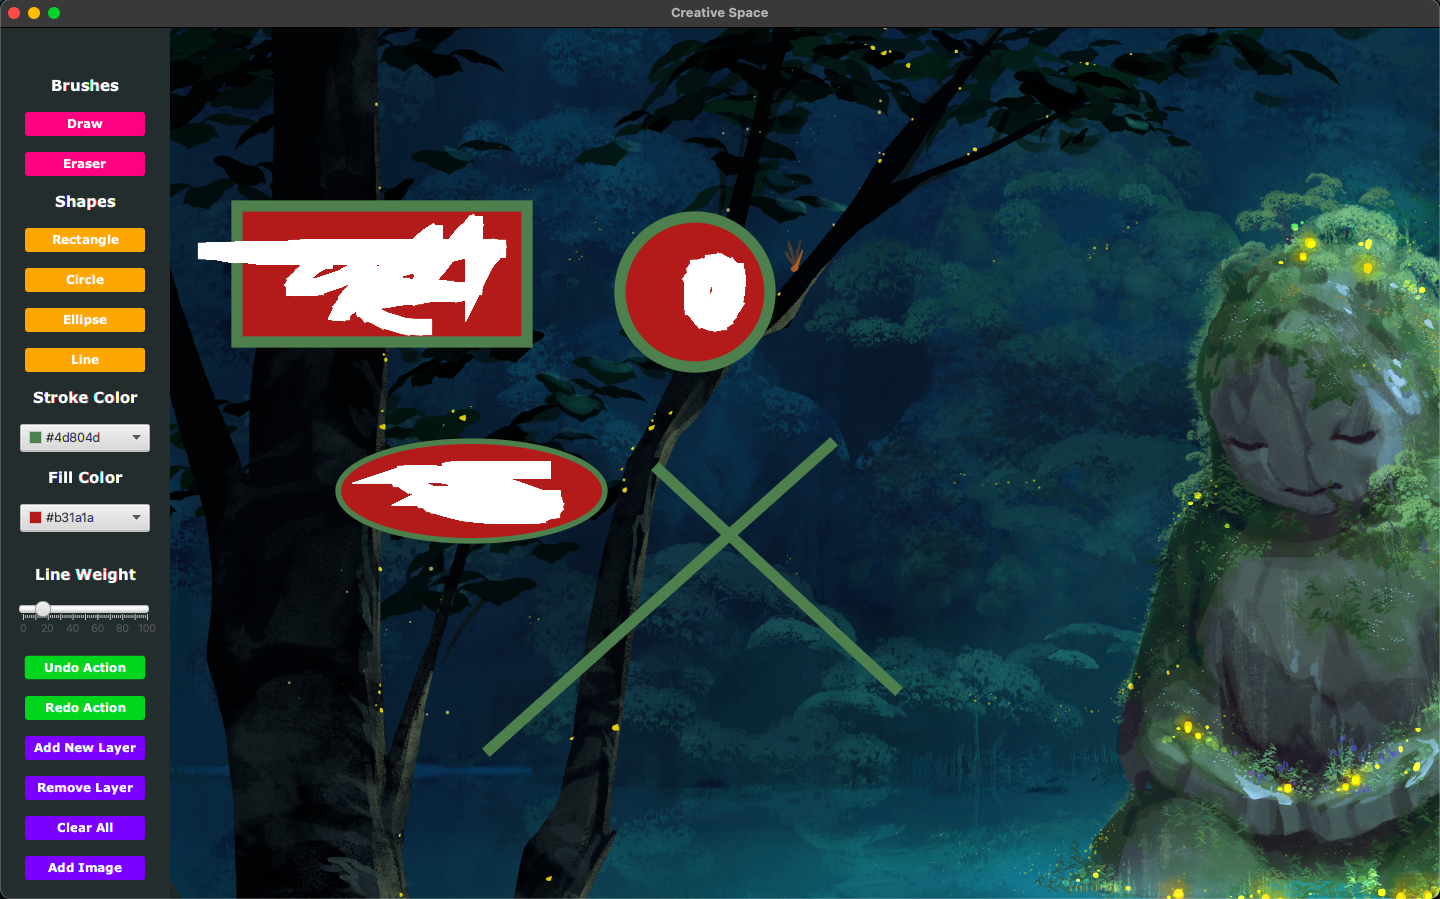
C R E A T I V E S P A C E
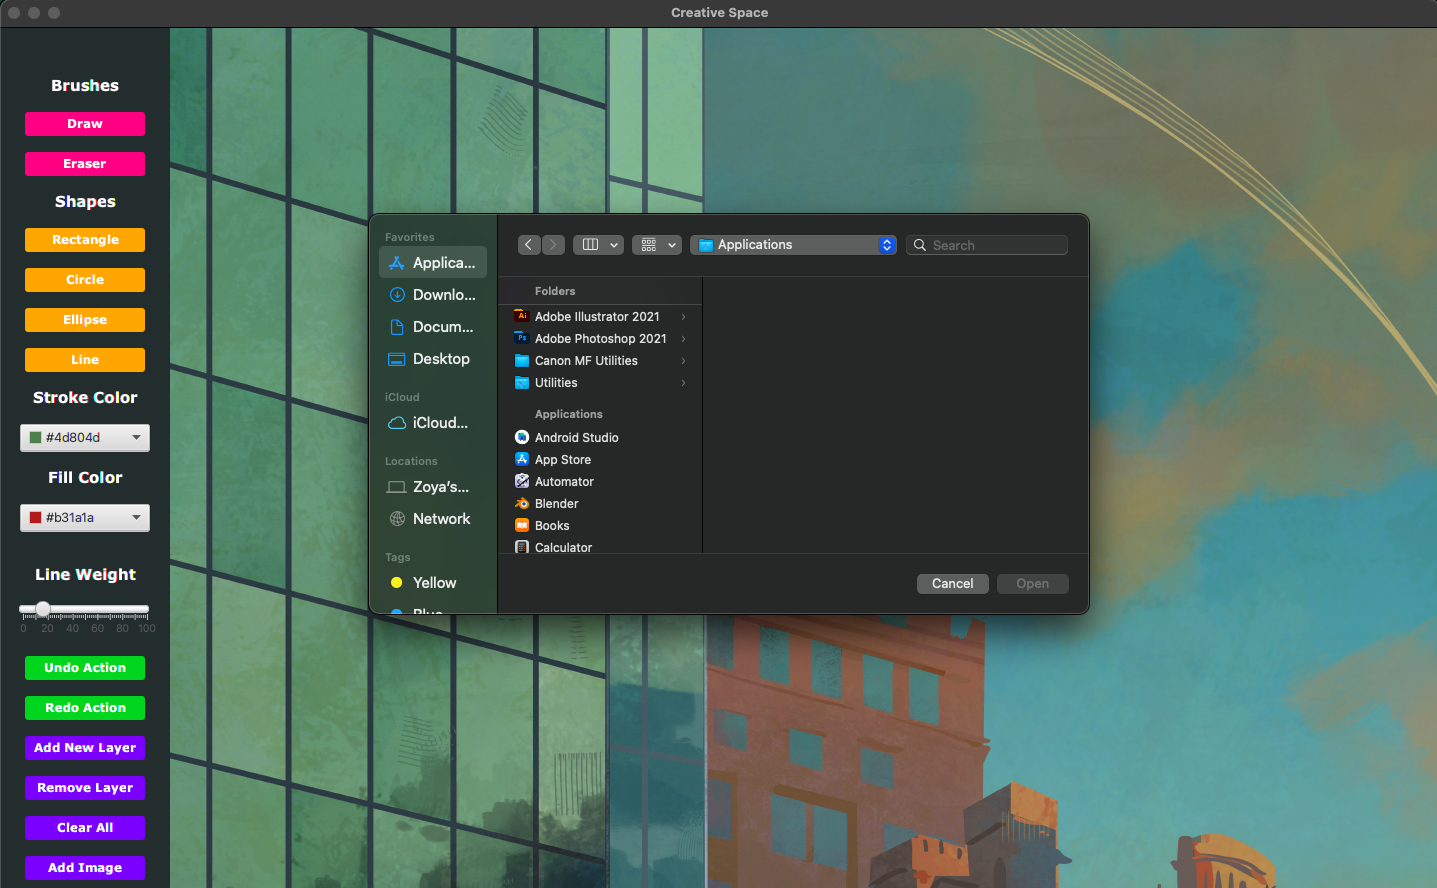
Goal: Create something that resembles programs like Paint or Photoshop We wanted to have a program that could draw shapes and lines of varying colors, shapes, and sizes, with an eraser, layers, the ability to undo/redo, and also clear the pane.
Skills: Object-Oriented Programming, Pair-Programming, JavaFX, Java, NetBeans, GUIs
Additional Details: The program also support saving and exporting functionality!
I N T E R F A C E :
B L E N D E R : P Y T H O N S C R I P T I N G
Goal: Model, sculpt, texture, and construct a photorealistic scene using Blender's Cycles renderer. Learn to extend some of Blender's functions using Python in Blender's built-in editor.
Skills: Python, UV Unwrapping, 3D Graphing, Animation
Additional Details: The cup was custom UV-unwrapped and the donut was texture painted and refined using Geometry Nodes. The sprinkles were done using a Python script to create multiple object instances.

C O V I D M O R T A L I T Y
2 0 2 0 A N A L Y S I S
Goal: Use real data from .csv files containing COVID mortality rates across the USA to calculate the approximate mortality rate in Maryland.
Skills: Python, Data Analysis, Google Colab, Excel, Jupyter Notebook
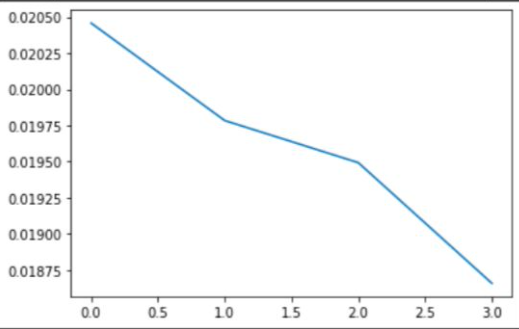
Additional Details (Results Summary): Over time, I found that the mortality rate was decreasing (likely due to more people quarantining and wearing masks). The mortality rate approached about 1.8%, which was just over half the mortality rate from the beginning of the pandemic (which was 3.4%)!
G R A P H:
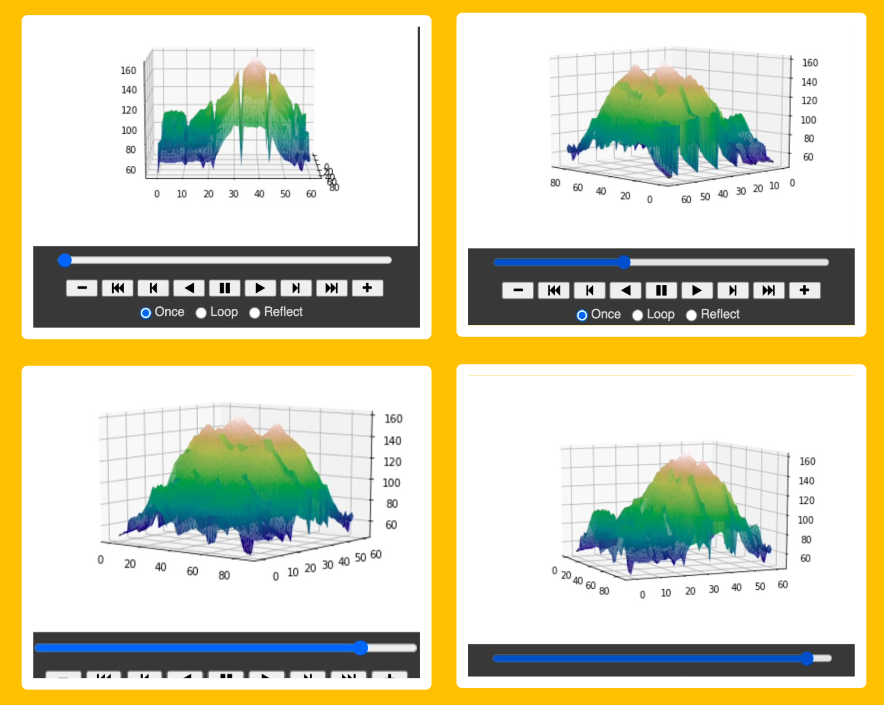
W E A T H E R I N G
Goal: Use real data to simulate weathering on a rough or mountain-like terrain. in Maryland.
Skills: Python, Data Analysis, Google Colab, Animation, 3D Modeling
Additional Details (Results Summary): Making this simulation was difficult because no exact formula
could calculate erosion rates due to the many natural processes and factors involved.
One of the first deliverables of the project was the generation of a realistic, 3D surface plot. I created a .csv file with over five thousand
coordinates to generate a piece of rough terrain.
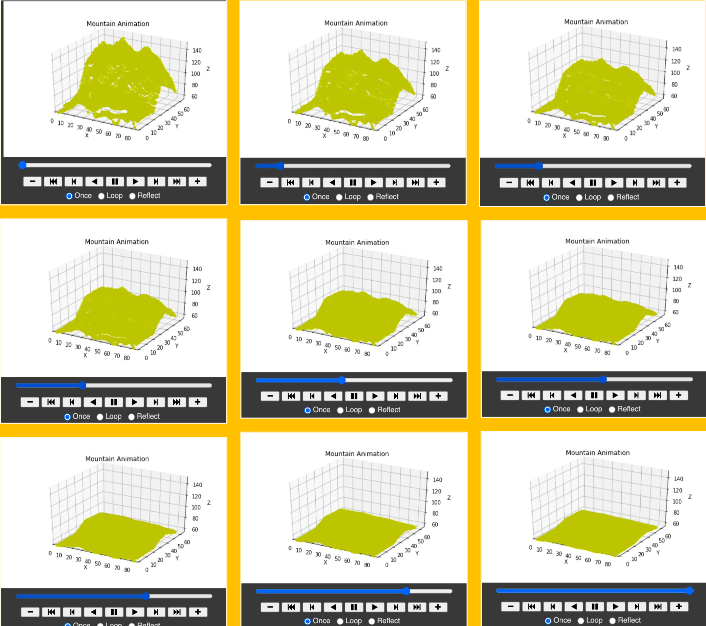
Four factors for erosion in the simulation: precipitation, wind speed, temperature, and humidity.
Interactive: factors are adjustable through the use of sliders. There is also a drop-down menu with four different soil types/compositions:
loam, clay, cropland, and limestone. The final outcome of the project displays a 3D scatterplot of terrain which displayed the rate of erosion depending on the factors a user alters.