Our project was based on predicting which alliance would win in a robotics match.
So, to understand our goal, you’ll have to have a basic understanding of the kind of robotics we’re talking about.
FIRST is a non-profit organization.
It comprises different levels of robotics for different age groups and, of these, offers two programs for high schoolers-
FIRST Robotics Competition (FRC) and FIRST Tech Challenge (FTC) which are more commonly known as FRC and FTC.
FRC generally seems to require a bit more game strategy and offers more statistics about matches and
teams given the more complex game structure.
For context, FRC robots are around 5 feet tall, whereas FTC robots are only 18x18x18 inches.
The respective game fields match this size difference with FRC fields being about as large as a basketball court and FTC fields being
only 12x12 ft. Since the fields and robots are larger in FRC, this allows the games to be more intricate and have more elements.
The Game
We chose to make the focus of our project the 2018 season because we had a lot of previous knowledge about this specific game.
FRC games are played between two alliances (red and blue) consisting of three teams each. Each game is split into two periods.
The autonomous period is a pre-programmed first 15 seconds of gameplay where the robots on each alliance try to complete different tasks that are
valued differently for points based on difficulty. The next 2 minutes and 15 seconds of gameplay are the teleop - or driver controlled - period of
the game. This is the part of the game where teams control their robots using game controllers and complete tasks while also obstructing the opposing
alliance's ability to score.
The 2018 game involved the alliances competing for “ownership” of three balancing structures—two switches and one scale. To achieve
“ownership,” an alliance had to score more powercubes (which were basically milk crates) than the other alliance by placing them into their
respective sides on each structure. The switches were placed on the floor and easy to score. Each alliance has a switch on their side of the field.
If they have ownership of their switch, they earn points—otherwise, they do not earn/lose points and neither does the other alliance. Thus,
the switches are intended for defense, and can sometimes be highly competitive. The scale is elevated and thus more difficult to score, and
whichever alliance has ownership of the scale earns a set amount of points per second. Therefore, the game is all about scoring as many
powercubes as possible while simultaneously preventing the other alliance from doing the same, so defense played a significant role in this game.
S C O U T I N G
What is Scouting?
The inspiration for our project came from a major part of robotics competitions that’s not related to actual gameplay.
Scouting (especially for top teams) is incredibly important to advancing to the next level of competition.
Scouting involves teams trying to learn and observe as much as they can about other teams throughout the competition.
Qualifying matches at competitions are random pair ups of teams, but teams advancing to the semifinals assemble their own alliances.
Our idea was that if we could get our network to predict the probability of which alliance would win a match,
we could—in theory—extend that to apply to scouting principles and use a neural network to predict which teams would
be the best on a certain alliance based on data from that competition.
Two apps/websites exist for FTC and FRC that record statistics on matches as they’re played, but being able to access a
network for scouting that could predict the best teams to have on an alliance would be beneficial to the robotics community.
Essentially, the network would do all the hard work of taking the raw data and statistics and turn it into which teams would work together the best.
Our goal was to see the accuracy at which our network could predict the probability of which alliance (blue or red) would win a
game given statistics about each team on each alliance throughout the season so far.
The reason we constricted our data to a single season is that while “strong” teams are generally consistently strong,
members and thus skillsets change each year as seniors graduate and teams welcome freshman, so we wanted to have the most
representative data for a team (we wouldn’t want the network to think a team was really good based on the last 4 years and
predict that team winning even though they were no longer
a top team in the fifth year. This did bring up the issue of maybe not having enough data for the network to be good, but we went
ahead with that in mind.
D A T A
Collecting the Data
We collected our data from The Blue Alliance. This site exists for FRC where
statistics for each team are recorded for all matches at all levels throughout the season.
This database has been around for the past 16 years, or seasons, and for each competition, it has rankings of all the teams at
competitions, data for all the matches played, data on each team, and data on awards received.
For our purposes, we needed to access the data on all the matches played and each team.
However, the data couldn’t be downloaded directly from the website, so we had to access it through an API call. Here's an
example of what the data from the website looks like:
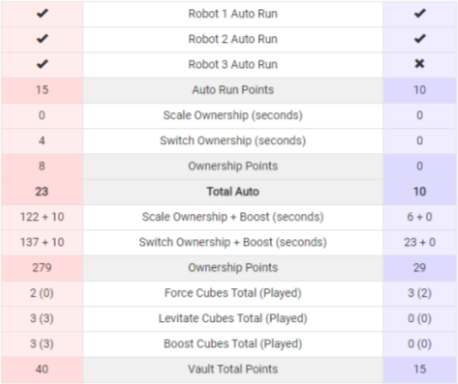
Sample Data
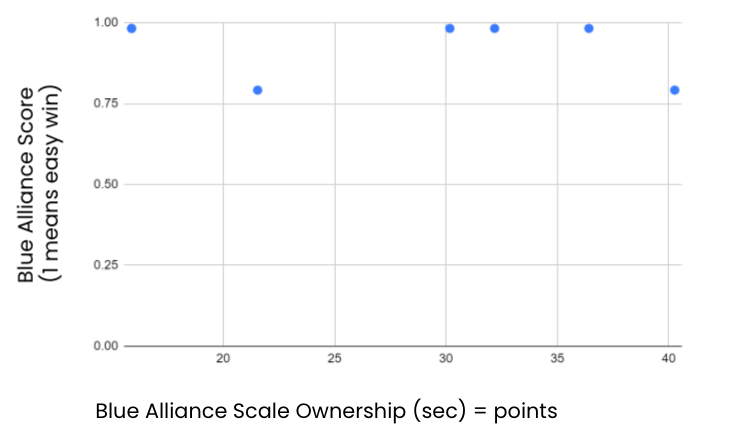
This is some sample data—it is the blue alliance’s scale ownership.
Again, the scale in the 2018 game was the main scoring structure, and essentially the most competitive part of the game.
There isn’t much of a correlation between the points scored or seconds owned and how well the blue alliance won overall.
This could be due to the data points not including lower scores, or that the data set just isn’t big enough.
This was just the data from the first few matches, but it shows an example of one of the features we used.
Formatting the Data
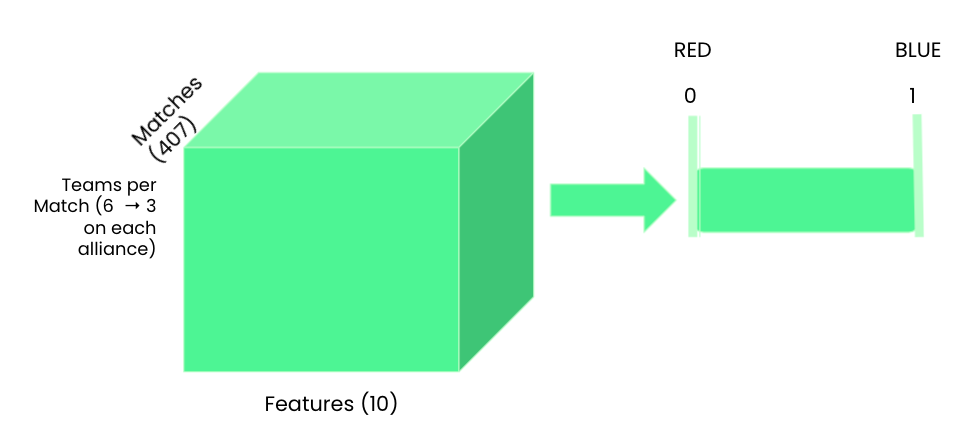
In our dataset, there are 407 matches that make up the training data, and for each match, there are 6 teams and 10 attributes or
properties for each team. So, our data started off by being a 3 dimensional array of matches, teams, and attributes.
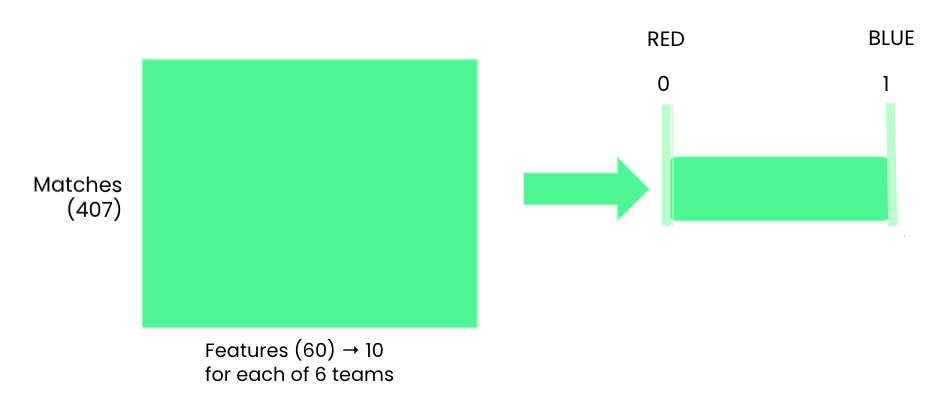
We had to “flatten the data,” which basically meant making the 6 teams and 10 attributes one dimension of the array
rather than two separate dimensions, so we ended up with a 2D array [470, 60]. See the images below.
The 10 properties of each team that’s included in this data
are auto run moving off, auto run scale, auto run switch, scale ownership,
switch ownership, endgame, fouls, defense, and strategy.
These 10 properties are important to have in our data because these are the factors that made up the game strategy/setup from the games
we’re pulling data from. The first three properties relate to the autonomous game period and the ownership properties relate to the teleop
game period. The defense and strategy properties aren’t point based, but are important to the nature of
the game.
Our labels for the data are values between 0 and 1 that we calculated by dividing the final blue score by the blue minus
red score. What the results mean is that any value greater than 0.5 would favor the blue alliance winning, with values closer to 1
being a higher chance of winning and values closer to 0.5 indicating a closer match. Similarly, values less than 0.5 would then indicate
the red alliance winning and values closer to 0 would be greater gaps in alliance scores and more clearly defined victories.
T H E N E T W O R K
Network Layers
Since our network needed to take in multiple factors for each team and match to predict a certain outcome,
we opted to configure our network with dense layers.
We built our model using 5 layers with 9 nodes on the first layer, 18 nodes on the second layer,
9 nodes on the third layer, 3 nodes on the fourth layer, and 1 node on the last layer.
Our last (output) layer only has one node, because we only want the network to output one value.
This value is between 0 and 1 and should represent the values in our label array.
The closer the network is to 0, the more it’s predicting that the red alliance won and the closer it is to 1,
the more it’s predicting that the blue alliance won.
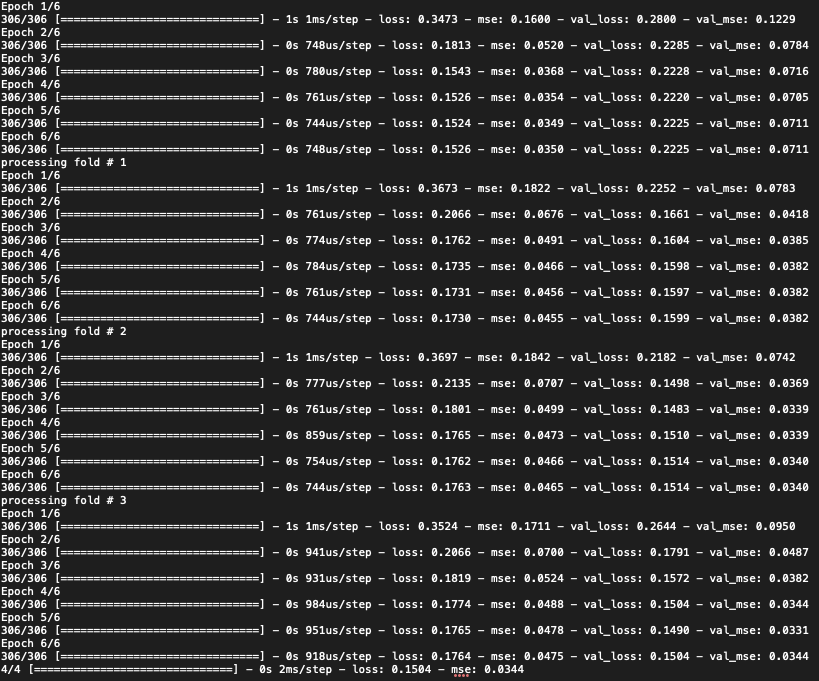
Because we had a small quantity of data, we decided to use the k-fold method, which consists of splitting the data into
k-number of partitions. The model trains on all but 1 partition, and then validates itself on the remaining partition.
The network averages the results of each k-fold to reduce the statistical variation between the models.
This allows the model to make the most of a limited amount of data. Using the k-fold method allows the network to see more
comprehensive data and train better/ have better accuracy across the whole dataset. We were able to get down to a reasonably low loss.
R E S U L T S
Results
We found that 5 partitions worked the best because it set aside enough data for validation, while also giving the neural
network a lot of data to work with. We found that around 7 epochs or iterations, the model started to slightly overfit, meaning
the loss went up. The model began to get too familiar with the training data.
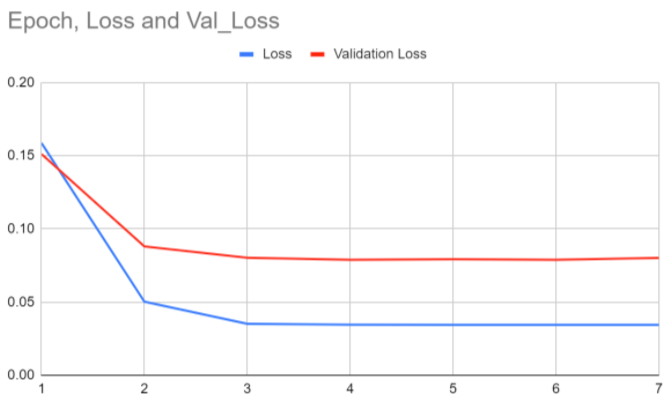
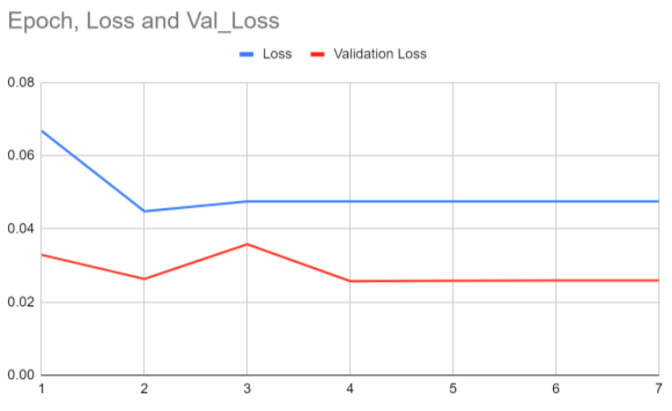
Below, you'll find our results for folds 1-5 (1 graph for each fold).
As you can see in the first graph, both the blue
loss and the red validation loss quickly descend to an almost straight line, but the validation loss is significantly above the
loss from the training set. This is because the validation is new data that the model is unfamiliar with, so the model will have
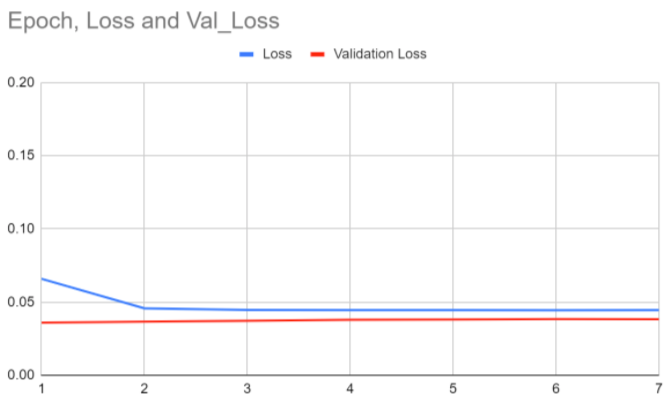
greater losses. Fold 2 means that the epochs were run again, but with a different partition excluded for validation. In Fold 2,
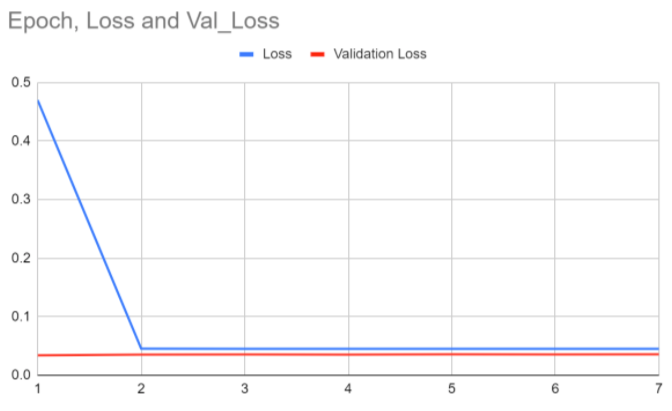
the neural network continued to improve, as both losses start from a lower position. Fold 3 is interesting because the blue loss
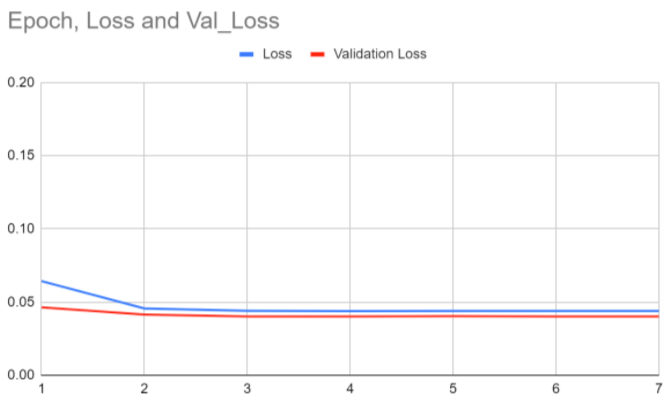
seems to start from higher point there, but the scale is actually much smaller. In Folds 4 and 5, the model also appears to overfit,
as the losses actually do start higher.
The graphs show that the blue loss and red validation loss center around 0.05 and 0.03 respectively, which is a reasonable loss
for a complex problem like ours.
Accuracy
C O N C L U S I O N S
Implications
In more recent years, robot games have started to incorporate some human players.
Incorporating human players into the network is something that could help boost the accuracy of the predictions and is something that we
would like to also add to the network in the future.
Another implication is the prospect of DC-ing, or disconnecting during the robot game. It’s almost impossible to predict when a robot might
disconnect and this can make or break a game for a team or alliance. Also, robots break a lot. Sometimes
they crash into field objects or even other robots. While they are often built to withstand those impacts, we’ve been
in many situations where we’ve had to perform emergency robot surgery before a game at competitions. Parts can break, go missing,
and sometimes wires even get accidentally cut in the process. So accounting for those factors is really difficult and these would be
pretty hard to incorporate into the network.
Future
If we were to continue developing this project, we would definitely want to explore the possibility of being able to use data
from more than one season. Data from previous seasons also wouldn’t really be useful if we were trying to
predict the best alliance partners during a certain competition because the stats for that season would be the only ones relevant to the
game. Data from a different game wouldn’t hold much weight as compared to data from the current season. However, we could still see if
we could use some properties from previous seasons (maybe not directly related to the game), and have them weighted less overall in the
network so the current season’s data would still hold the most precedence over the networks training and prediction. Doing this would
allow us to have more data points and hopefully create a better network.
Another extension to this project that we would look forward to working on would be creating a similar network/ scouting system for FTC.
We determined that FTC would be harder to make this network for, considering strategy and especially defense aren’t as influential in FTC
games - FTC robots don’t actively try and stop the opposing alliance from scoring and teams can very easily be penalized for trying to.
FTC would already have less data for a season/team so it would be essential that we find a way to incorporate data from other seasons as well.